The Colour-Magnitude Relation for Elliptical Galaxies
Introduction
In the following experiment you will be measuring the colours and
magnitudes of galaxies in a distant rich cluster from a CCD image
taken with Hubble Space Telescope
(HST). By plotting this information on a colour-magnitude diagram
you can study the properties of the galaxy population in the cluster.
Including information about the morphologies of the galaxies (from
the high resolution HST image) into this analysis you can measure
the relationship between colour and apparent magnitude for early-type
(elliptical and S0) galaxies in the cluster. Finally, you can compare
the predicted colour of a galaxy of a known luminosity from the local
Universe with what you observed in the distant cluster to estimate how
much bluer early-type galaxies were in this distant cluster. Using the
theoretical rate of change of colour for a mix of stars as a function
of age you can then convert this observed colour difference into an estimate
of the lookback-time to the epoch when the cluster is observed.
This section starts with a brief overview of the properties of
clusters of galaxies, before
introducing two concepts which are necessary for completion of the
lab: galaxy morphology
and colour-magnitude diagrams.
Clusters of Galaxies
 Cluster of galaxies are the most massive
collapsed structures in the Universe, the largest ones have central
masses in excess of 10,000 × the mass of our galaxy. These very
rich clusters are intrinsically rare objects, and most galaxies in the
Universe inhabit the field, crudely defined as the lower-density
regions outside clusters and voids. The most massive nearby cluster
is the Coma cluster (left) the
central regions of which are dominated by two super-massive elliptical
galaxies. The extreme conditions found in such rich clusters including
very high densities of galaxies, as well as large amounts of very hot
gas which emit at X-ray wavelengths, making clusters some of the most
luminous X-ray sources in the
sky. More information about clusters can be found here.
Cluster of galaxies are the most massive
collapsed structures in the Universe, the largest ones have central
masses in excess of 10,000 × the mass of our galaxy. These very
rich clusters are intrinsically rare objects, and most galaxies in the
Universe inhabit the field, crudely defined as the lower-density
regions outside clusters and voids. The most massive nearby cluster
is the Coma cluster (left) the
central regions of which are dominated by two super-massive elliptical
galaxies. The extreme conditions found in such rich clusters including
very high densities of galaxies, as well as large amounts of very hot
gas which emit at X-ray wavelengths, making clusters some of the most
luminous X-ray sources in the
sky. More information about clusters can be found here.
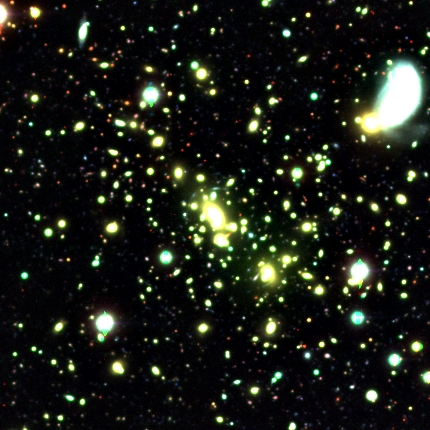 The image to the right illustrates
a view of the central regions, a 1 Mpc across, of a distant rich
cluster. This is a true colour image, constructed from individual
exposures through blue (B), visual (V) and infrared (I) filters, and
the large numbers of yellow galaxies are the
luminous cluster galaxies (the large interacting spiral in the
upper-right hand corner is foreground of the cluster). The strong
central concentration of yellow, elliptical and S0 (see below) galaxies
in the cluster can be readily seen, and the cluster centre is further
highlighted by the massive dominant elliptical galaxy lying at the
bottom of the cluster's potential well.
The image to the right illustrates
a view of the central regions, a 1 Mpc across, of a distant rich
cluster. This is a true colour image, constructed from individual
exposures through blue (B), visual (V) and infrared (I) filters, and
the large numbers of yellow galaxies are the
luminous cluster galaxies (the large interacting spiral in the
upper-right hand corner is foreground of the cluster). The strong
central concentration of yellow, elliptical and S0 (see below) galaxies
in the cluster can be readily seen, and the cluster centre is further
highlighted by the massive dominant elliptical galaxy lying at the
bottom of the cluster's potential well.
Galaxy
Morphology and Elliptical Galaxies
A galaxy's ``morphology'' is a description of the structure
of the galaxy, e.g. spiral or elliptical,
and is typically estimated by eye from optical images. A number
of schemes have been constructed to classify galaxy morphology
into different classes and in this way to attempt to understand
the physical processes which define galaxy morphology and from this
gain a deeper understanding of galaxy formation and evolution.
The major visible components of giant galaxies are the bulge and
disk. The bulge is a roughly spherical cloud of stars in the central
parts of the galaxy, this cloud is mostly supported by the random motions of
the stars within it. The disk component is a rotationally supported,
usually quite thin and extending to larger radii than the bulge
component. The disk can also show spiral arms resulting from on-going
star-formation in the gas-rich disk material. The bulge and disk are
thus the morphological features which are typically used to classify
galaxies. Specifically, the relative luminosities of the disk and
bulge components of the galaxy and the degree of contrast of the arms
in the disk are used to separate galaxies into different classes. The
presence of a linear bar-like feature in the galaxy is also used to
classify galaxies. The figure below shows the classical tuning fork
classification diagram of the Hubble galaxy morphology scheme. In the
Hubble scheme galaxies are ranked on the relative strength of the bulge
and disk components: galaxies with a massive bulge, but no visible disk
are termed ``Elliptical'' (E), those with large bulges and a small disk are
``S0'' galaxies, after this come the various sub-types of spiral galaxy
- Sa, Sb, Sc, Sd - a sequence of decreasing bulge luminosity compared
to the disk light (this sequence is also described as one from early-
to late-type spirals). There is a parallel sequence of barred spiral galaxies,
and Elliptical galaxies are further catagorised on the basis of their
shapes: E0 (circular) to E7 (highly elliptical).
Below are postage stamp images of each of the main morphological classes.
These images have been taken from the digitised version of the Sky Survey.
The description above applies to massive luminous galaxies. There are
also a wide range of dwarf galaxies which share some of the same
characteristics of the luminous galaxies, as well as classes of
low-surface brightness galaxies and other peculiar galaxies, leading to
a wide and rich variety of morphological classes. Furthermore,
morphologies of galaxies in the distant Universe acquired with the
Hubble Space Telescope indicate that an increasing number of
galaxies at earlier epochs are hard to place within the confines of the
standard Hubble scheme set out above. This implies that a galaxy's
morphology can change over the course of its lifetime. Nevertheless,
galaxy morphologies remain some of the most basic and most useful
information which can be gleaned for a galaxy. The importance of
morphology is shown by the good correlation between a galaxy's
morphology and the rate of star-formation within the galaxy, with
later-type spirals showing stronger star-formation. Another strong
morphological correlation is between galaxy morphology and galaxy
density - with early-type galaxies (E/S0/Sa) being preferentially found
in regions of higher galaxy density (the cores of rich clusters of
galaxies) and later-type spiral galaxies inhabiting the lower density
surrounding regions (termed the ``Field'').
Colour-Magnitude Diagrams
The remainder of this lab will concentrate on the properties of the
galaxy population of a massive cluster at high redshift. The majority
of the bright galaxies in this cluster are early-type galaxies (E/S0).
These galaxies show a strong correlation between their colours and
their luminosities (or masses), with brighter/more massive galaxies
being redder and fainter/less massive ones bluer. This can be seen in
the figure below which shows
the colours and magnitudes of galaxies in the cluster shown in this image. The galaxy colours are measured
from the apparent magnitudes of the galaxies in two different regions
of their spectra: through a filter in the blue (B) around 4500Å
and one in the infrared centred close to 8100Å, called the I band.
The colour is expressed as simply the difference between the magnitudes
in B and I: hence, (B-I). The strong linear feature between I=18-22 with
a colour of around (B-I)=3 is formed by the E and S0 galaxies within
the cluster. At fainter magnitudes this relation fades and a population
of faint blue galaxies becomes apparent. The linear relation for the
brighter galaxies indicates that most of the E and S0 galaxies within
the cluster were formed via the same mechanism and that this mechanism
couples the colour of the stars formed within the galaxy to the final
mass of the galaxy.
One mechanism which can produce such an effect is the collapse
of a single, massive gas cloud forming all the stars in the galaxy in a
short period of time. The first supernovae from the initial burst of
star-formation produce large quantities of hot gas which is enriched in
heavy elements. The deeper potential wells of the massive galaxies can
contain this hot gas and it is therefore incorporated into the next
generation of stars which are formed. These stars then have higher
metal contents and this tends to make them redder. The hot gas
expelled by the supernovae in less massive galaxies can easily escape
the galaxy and hence it is not used in the formation of the next
generation of stars - which are therefore metal-poor and hence blue in
colour.
The same relation between luminosity and colour appears to hold in
different clusters at the same epoch. The important feature of the
colour-magnitude (C-M) relation of early-type galaxies for the purpose
of the remainder of this exercise is thus that in the local Universe
a specific luminosity of early-type galaxy has a well-defined colour.
We can use this relation to investigate the change in the colour of
early-type galaxies in distant clusters resulting from the younger
ages of the stars in these galaxies, which are observed as they were
several billion years ago.
Back to Main page